Infographics! There are so many quick and easy uses for infographics, so we thought we would share a few sites to get you started.
VENNGAGE
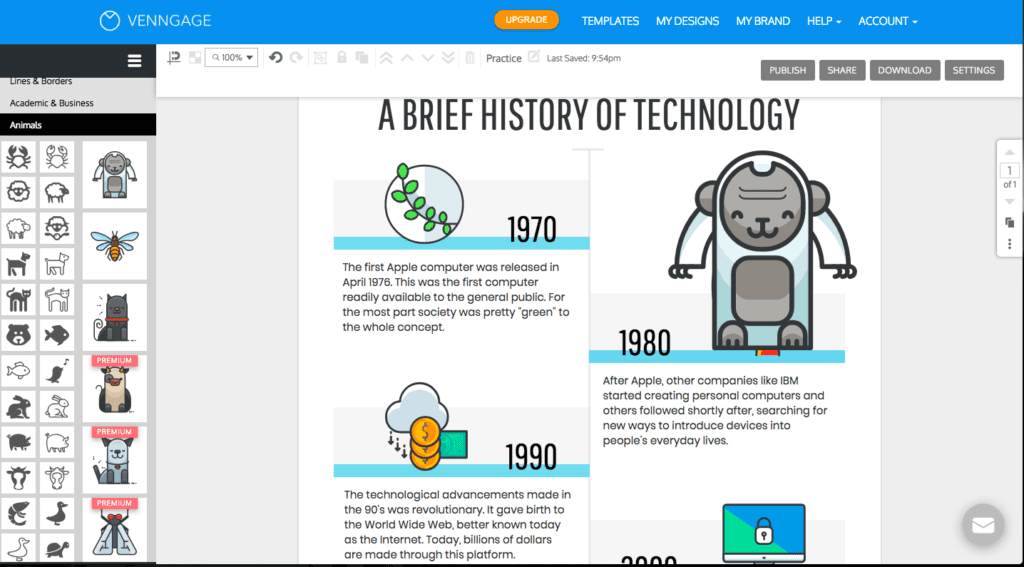
We start this episode with Venngage. Venngage is a great infographic site that has lots of creative options. Your students will love all of the template and icon choices that they’ll be able to explore!
INFOGRAM
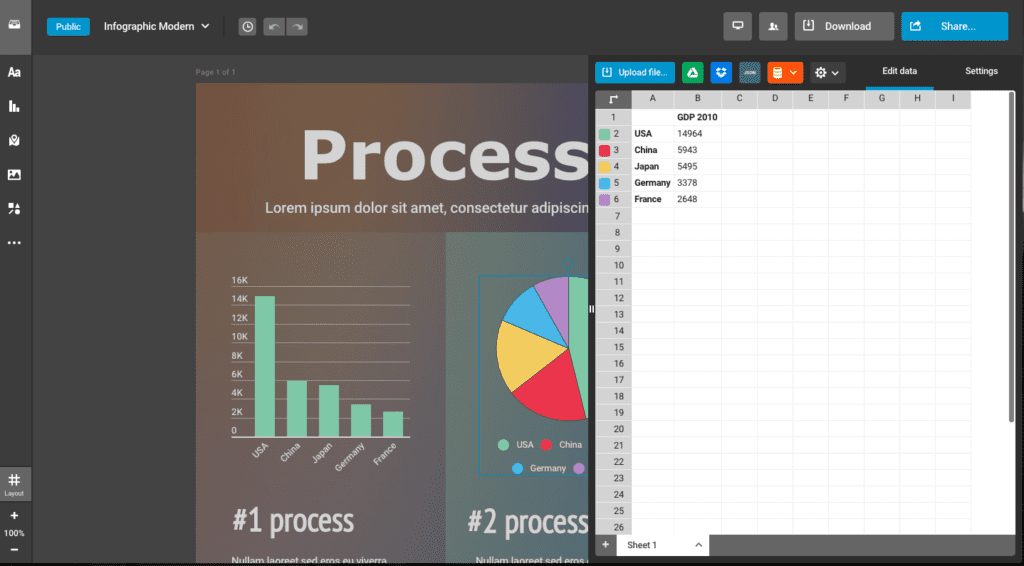
Then we talk about Infogram, a wonderful site for students who need more data-driven infographics. Infogram is an infographic tool that has a great selection of easy-to-use graphs for displaying data.
EASEL.LY
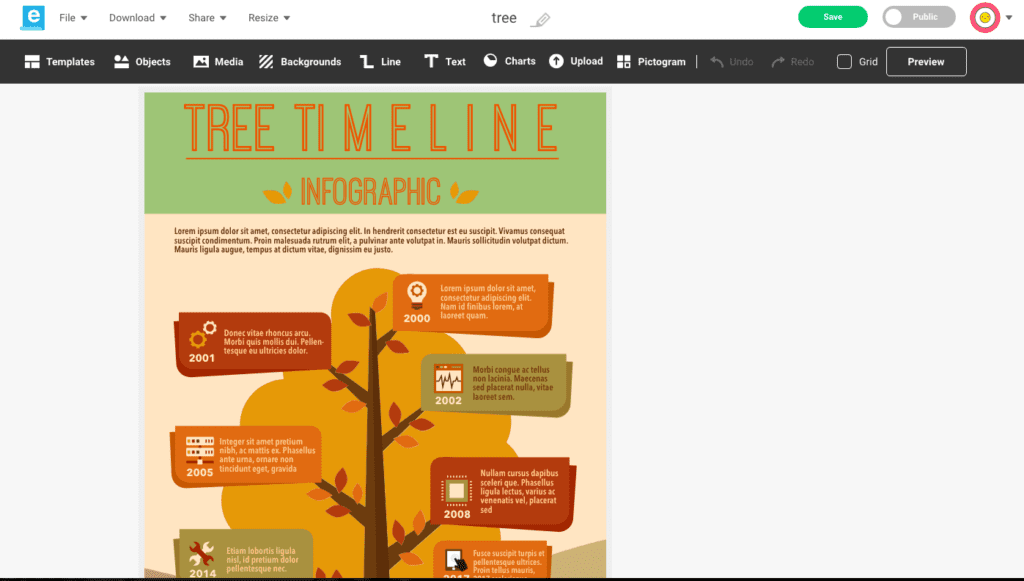
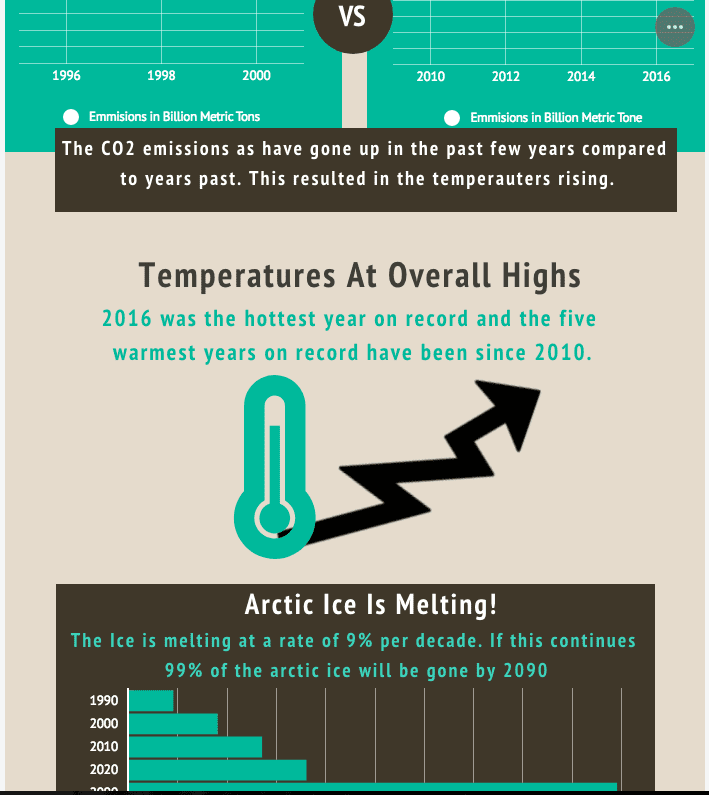
Last but not least is Easel.ly. This site has colorful, easy-to-use templates and it also has many sharing options.
TECH MENTIONED IN THIS EPISODE:
And there you have it! All of these sites can help your students share their knowledge quickly and creatively. Thanks, as always, for listening! We’ll talk to you again, next week!